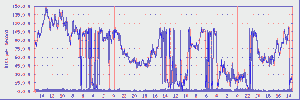
MRTG on a server shows the bandwidth usage increase or decrease sharply, it look like the web server is restarting too much. I have spend many hours looking into lighttpd web server as i thought web server is actually causing the problem. I do not see any error message in lighttpd error log while this happening.
At last a user at lighttpd IRC chat pointed out that it could be problem with server provider as i am using shared 1 Gbit line, so some one else may be pushing too much bandwidth at same time.
I have installed iftop on the server, it shows good bandwidth usage while MRTG shows the drop.
After some research i found this was caused by 32 bit counter and it can only count up to 110 Mbps. My MTRG drop is when usage go above the 110 Mbps limit. Solution was to run the MRTG cron job more frequently.
By default, it run every 5 minutes. So i changed it to run every 3 minutes.
[root@server24 ~]# cat /etc/crontab
SHELL=/bin/bash
PATH=/sbin:/bin:/usr/sbin:/usr/bin
MAILTO=root
HOME=/

# run-parts
01 * * * * root run-parts /etc/cron.hourly
02 4 * * * root run-parts /etc/cron.daily
22 4 * * 0 root run-parts /etc/cron.weekly
42 4 1 * * root run-parts /etc/cron.monthly
*/3 * * * * root env LANG=C /usr/local/mrtg-2/bin/mrtg /var/www/html/mrtg/core/mrtg.cfg

[root@server24 ~]#
The last line is cronjob for MRTG.
*/3 means run cronjob every 3 minutes.
See the left side of the MRTG graph, you will see the graph showing properly for using more than 110 Mbps. On right side, you will see the bandwidth usage shows drooping due to the counter reset.


